- Criterion Referenced Assessments
- Norm Referenced Assessments
- Measures of Academic Progress (MAP)
- Individual Growth and Development Indicators (IGDI)
Criterion referenced assessments
Simply put, a Criterion Referenced assessment is typically an assessment that was developed to assess a student’s mastery on a relatively limited number of achievement targets.
The resulting scores typically include a raw score, or a score indicating the percent of items (skills) the individual got correct in comparison to the total number of items on the assessment.
When interpreting the scores, one is only able to make judgments in relation to a functional performance level (cut score) and not in relation to how others performed on this assessment.
Norm referenced assessments
In contrast to a Criterion Referenced Assessment, a Norm Referenced Assessment is typically an assessment that was developed to assess a student’s performance on a wider sample of content within a specified achievement target.
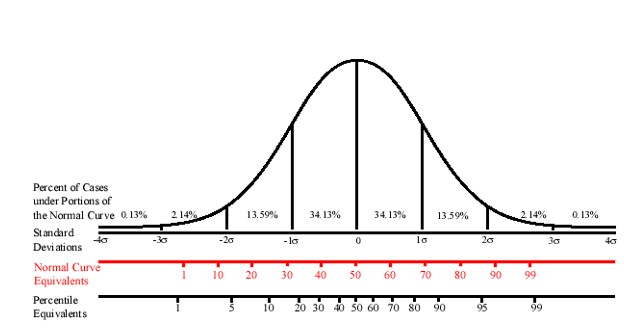
The results scores typically include a raw score as well as derived scores such as a standard score, percentile rank, Normal Curve Equivalent (NCE), as well as both age and grade equivalents.
When interpreting scores, one is able to make comparisons between the student’s performance with that of other students in a specified reference population of the same age and grade (norm group).

Measures of academic progress (MAP)
Measures of Academic Progress (MAP) are state/district-aligned computerized adaptive tests that accurately reflect the instructional level of each student and measure growth over time. Assessments are available for students in grades 3rd through 12th in the academic areas of:
- Reading
- Language Usage
- Math
- Science
New to the MAP assessment is a Kindergarten through 2nd grade assessment that measures skills in the areas of early literacy and numeracy.
Website Resources:
Individual growth and development indicators (IGDI)
Individual growth and development indicators (IGDI) are a set of research-based assessment measures of early language & literacy development that have been developed under the auspices of the University of Minnesota and Center for Response to Intervention in Early Childhood. They support the identification of students requiring additional levels of intervention in the key early literacy domains of oral language, phonological awareness, alphabet knowledge, and comprehension.
They are designed to be easy to administer, inexpensive, reliable, valid, sensitive to age and intervention effects, and to provide educators with formal assessments of child status and change over time in relation to important skill acquisition. Most significantly, the new measures are closely aligned with important instructional decisions that need to be made within the context of the RtI model.
The AEA system will continue to cover the full cost ($3 per child) to access the online data system and iPAD app for preschool programs that are currently using or are interested in starting to use the Individual Growth and Development Indicators (myIGDIs) for literacy screening for preschool learners during the 2019-20 school year. While the AEA system is providing this financial support to provide some consistency for preschool programs, it’s important to note that funding for future school years can not be assumed.
For additional information, contact: Michelle Haberman or Jessie Blohm
